From Raw Data to Clear Answers
This is the core of how I work. Business data lives across multiple tools — CRM systems, spreadsheets, ad platforms — and rarely speaks the same language. I build automated pipelines that pull it all together, clean and structure it, and deliver it to a set of purpose-built dashboards, each answering a different business question. No manual exports, no copying between tools, no outdated numbers.
Dashboards
Each dashboard is built around a specific workflow. A sales manager opens it in the morning to check where deals stand. A finance lead uses it to track incoming payments and flag overdue accounts. A team lead reviews call activity to see who's performing and who needs support. Click a dashboard below to see how it works in practice.
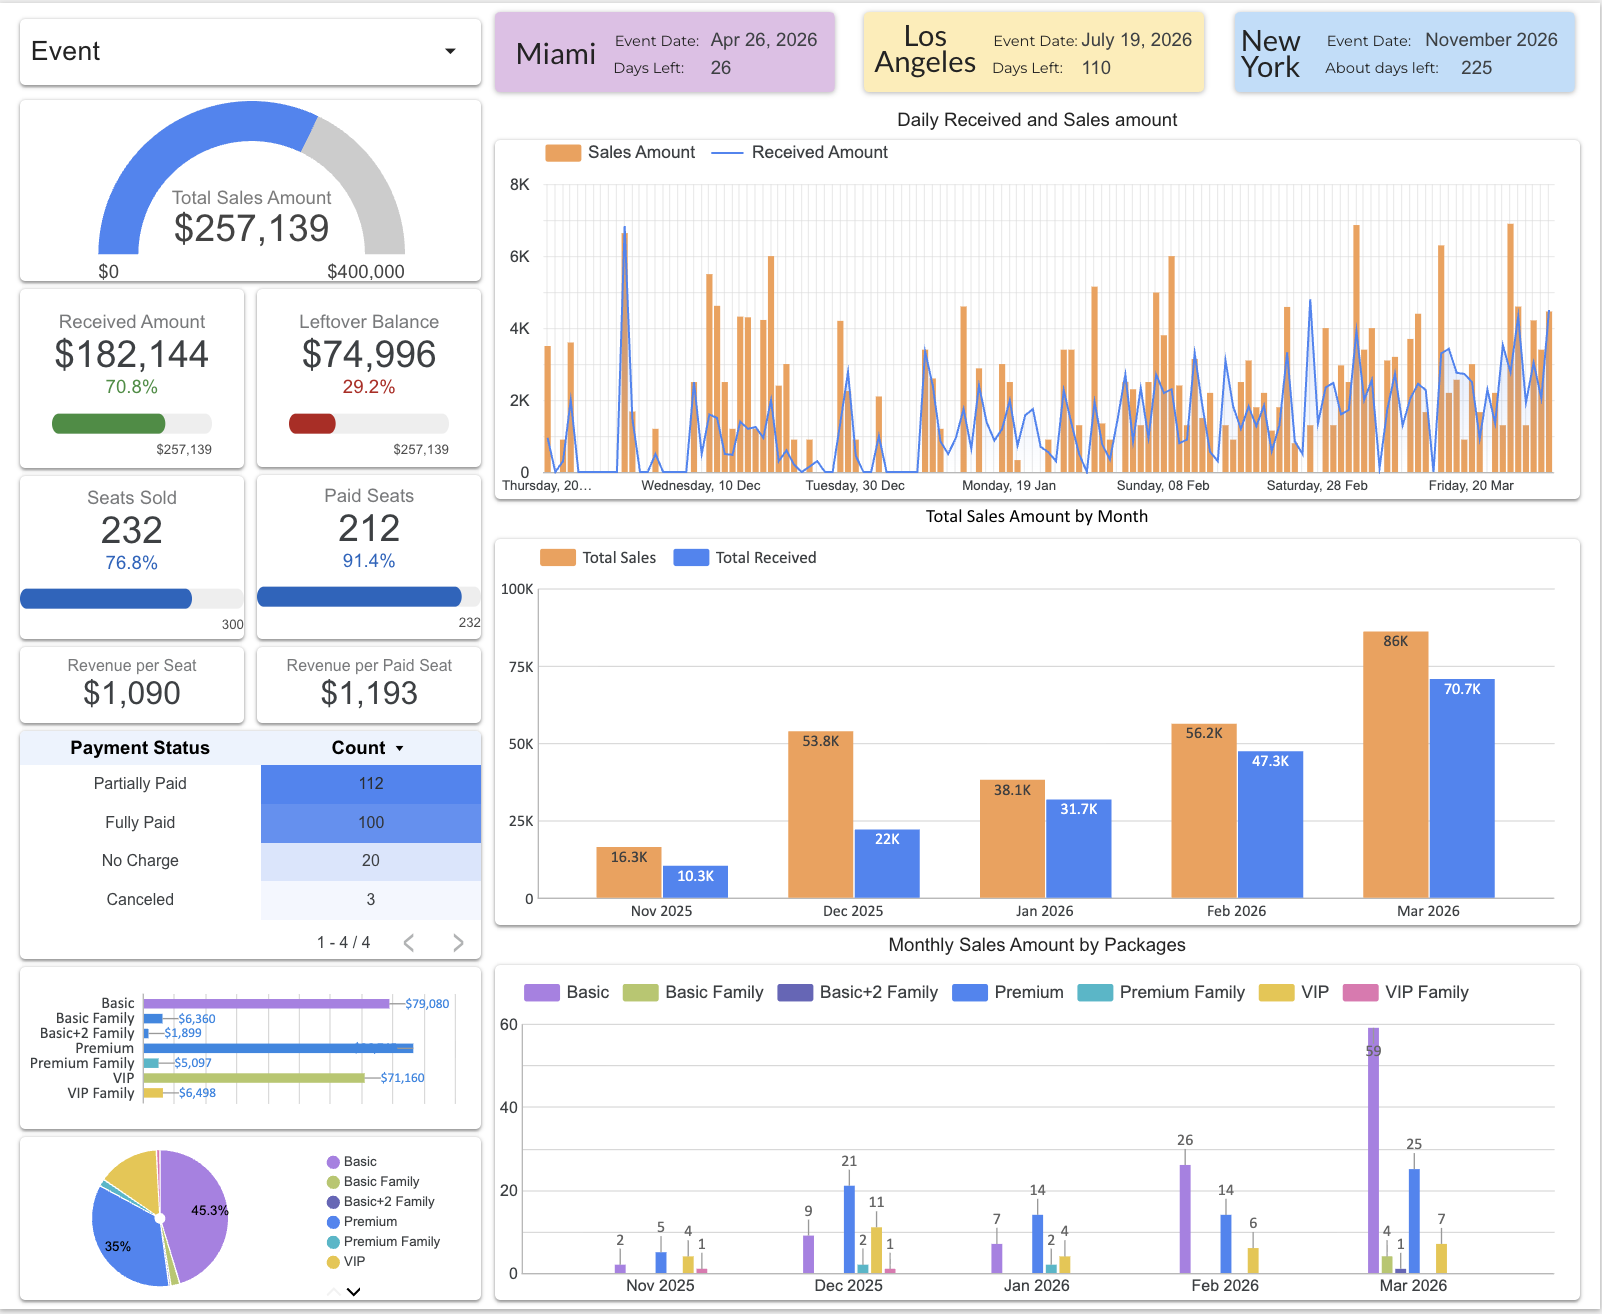
Sales & Event Performance
Tracks total sales, received payments, leftover balances, seat utilization, and payment status across events. Includes daily trends, monthly comparisons, and package distribution.
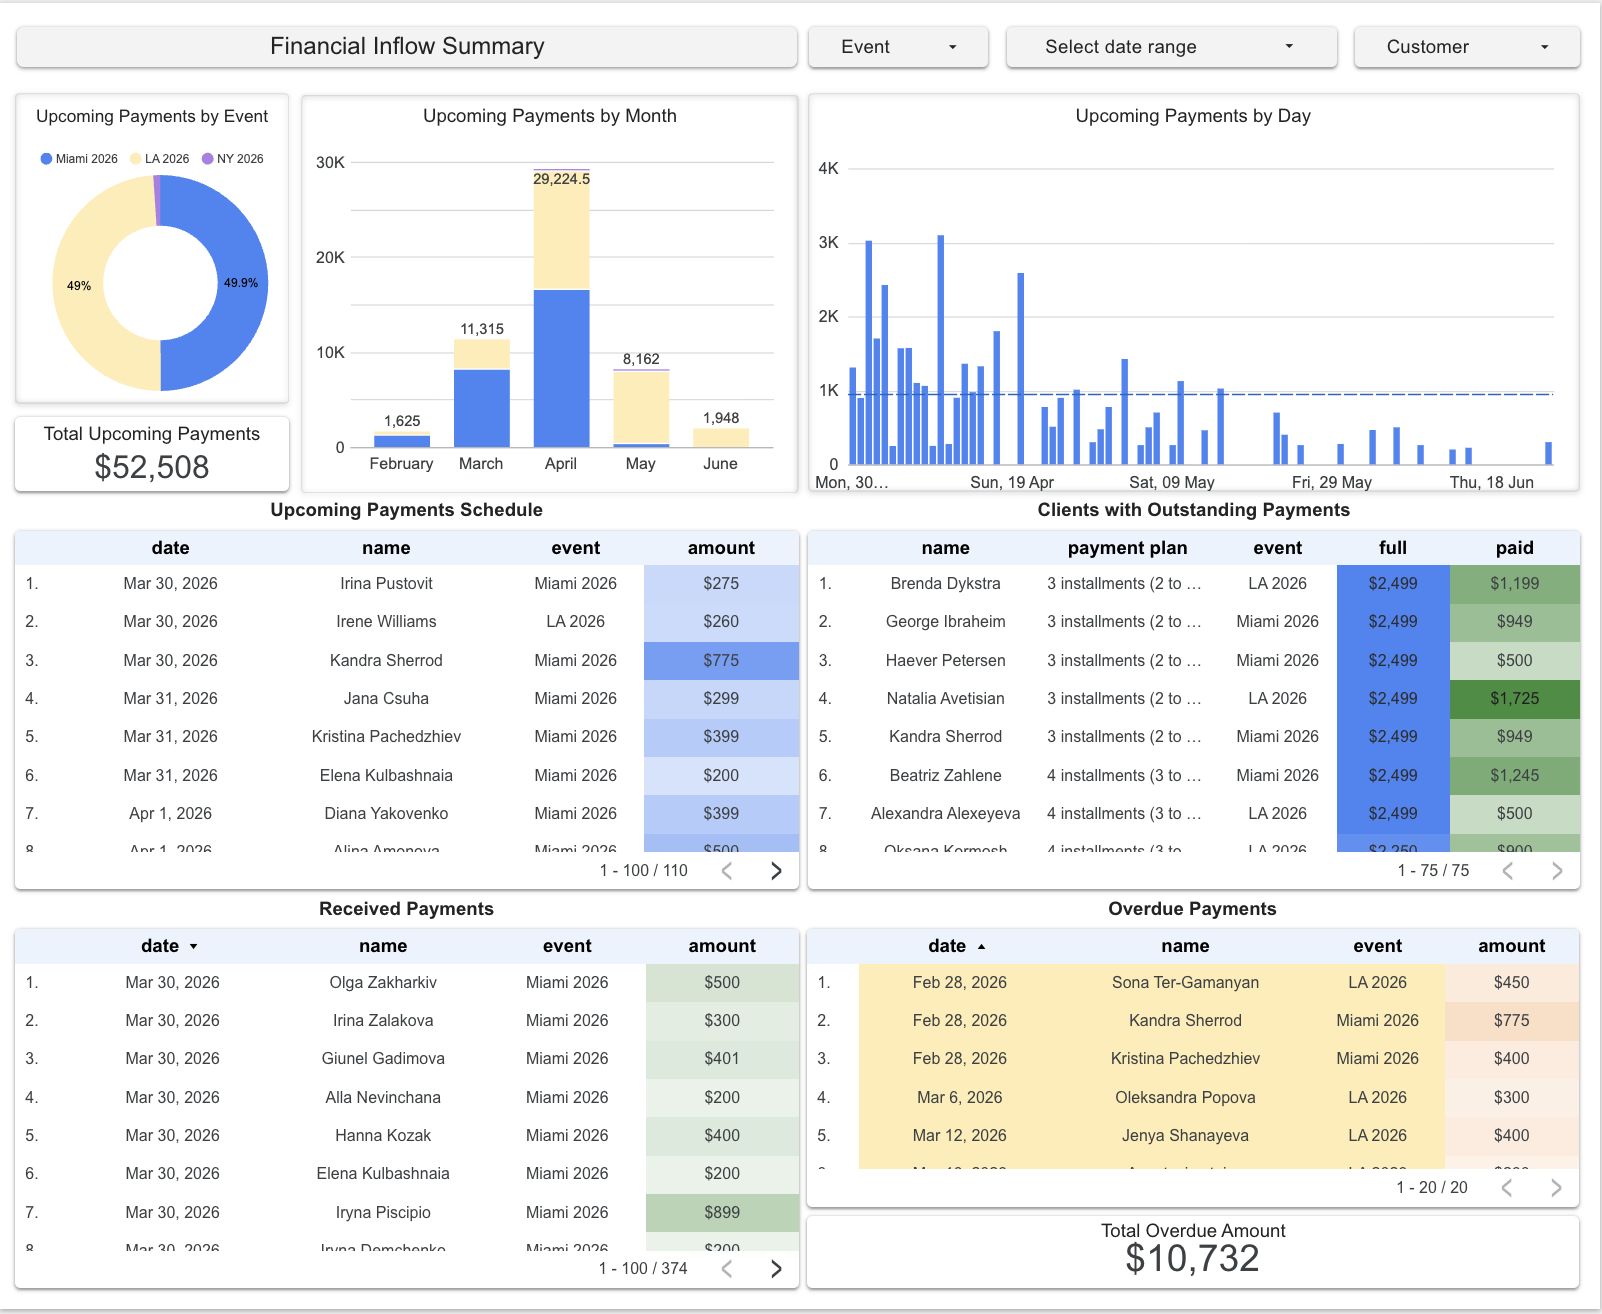
Financial Inflow
Comprehensive payment tracking — upcoming schedules by event and month, daily forecast, client-level outstanding balances with installment visibility, and overdue tracking.
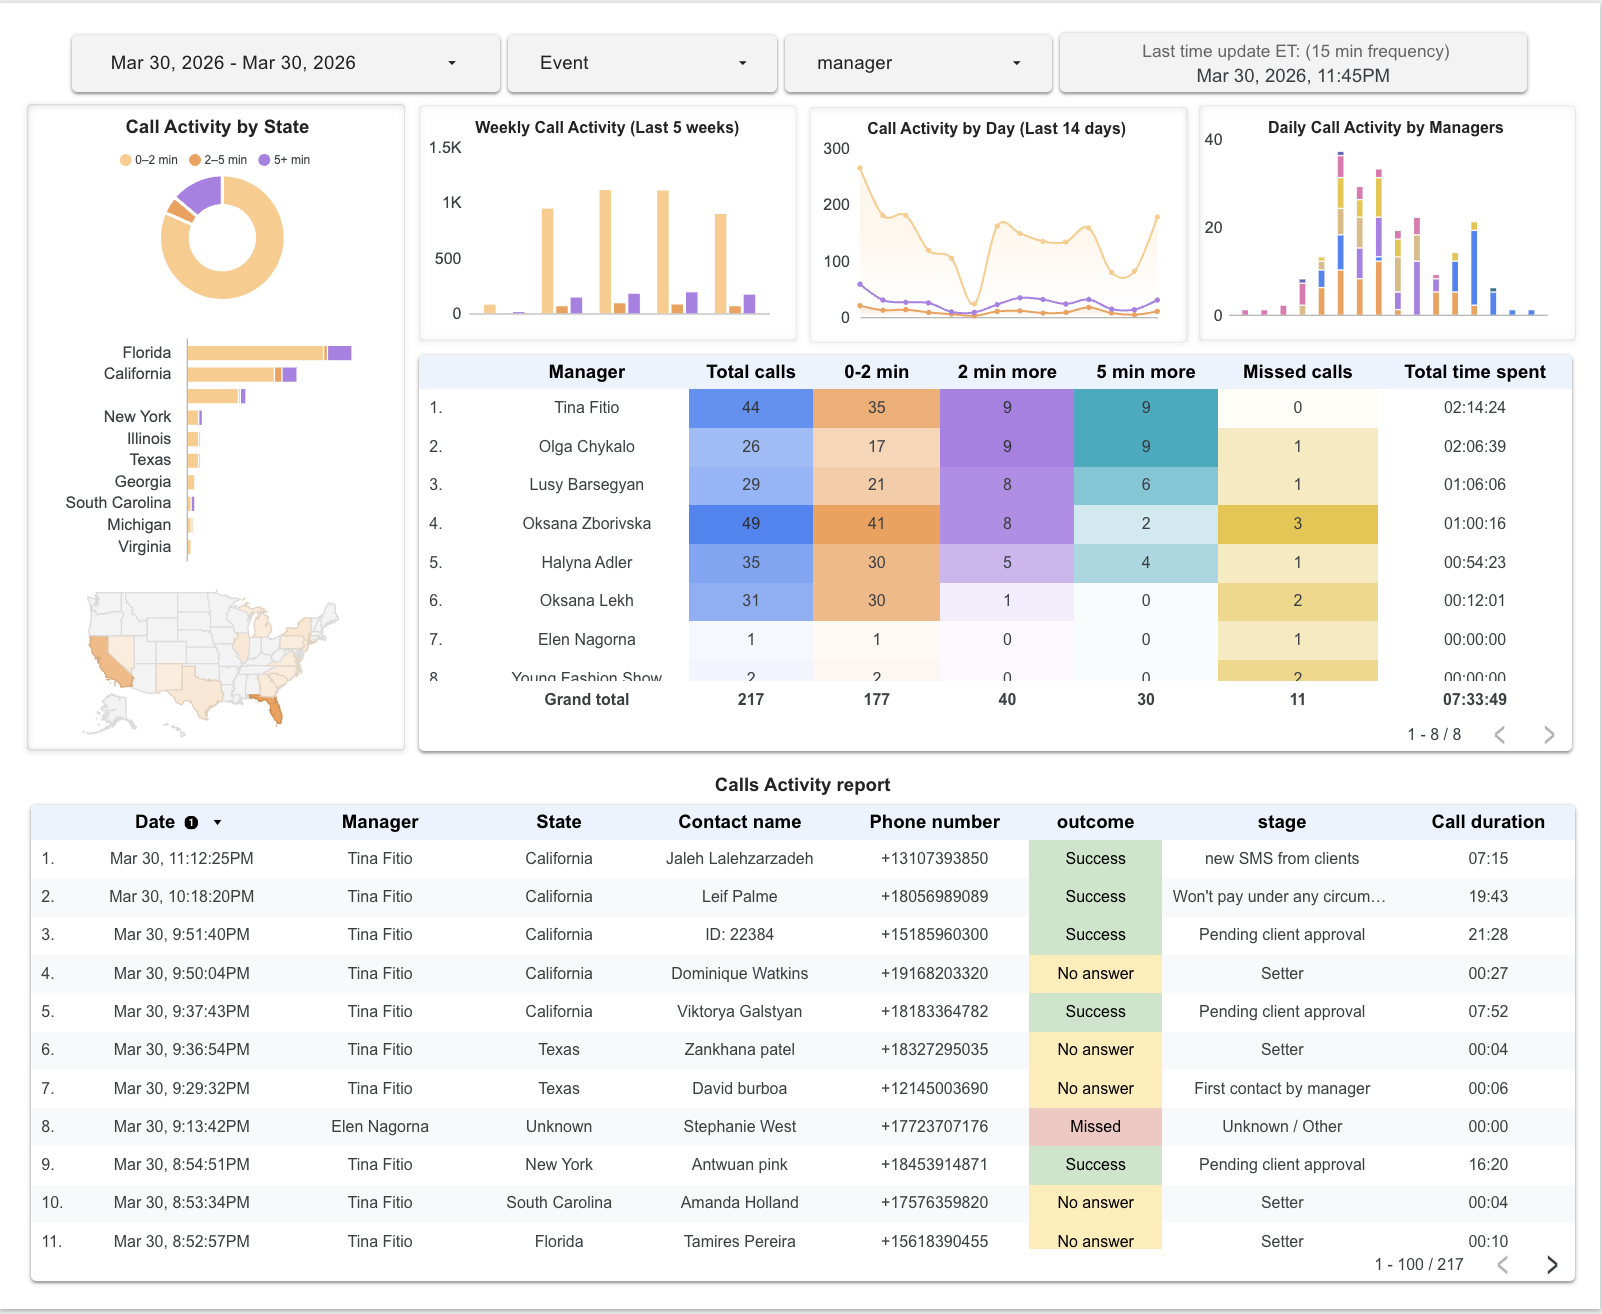
Call Activity Report
Real-time call monitoring with geographic distribution by state, weekly/daily trends, per-manager performance breakdown, and a full activity log with outcomes and durations. Auto-refreshes every 15 min.
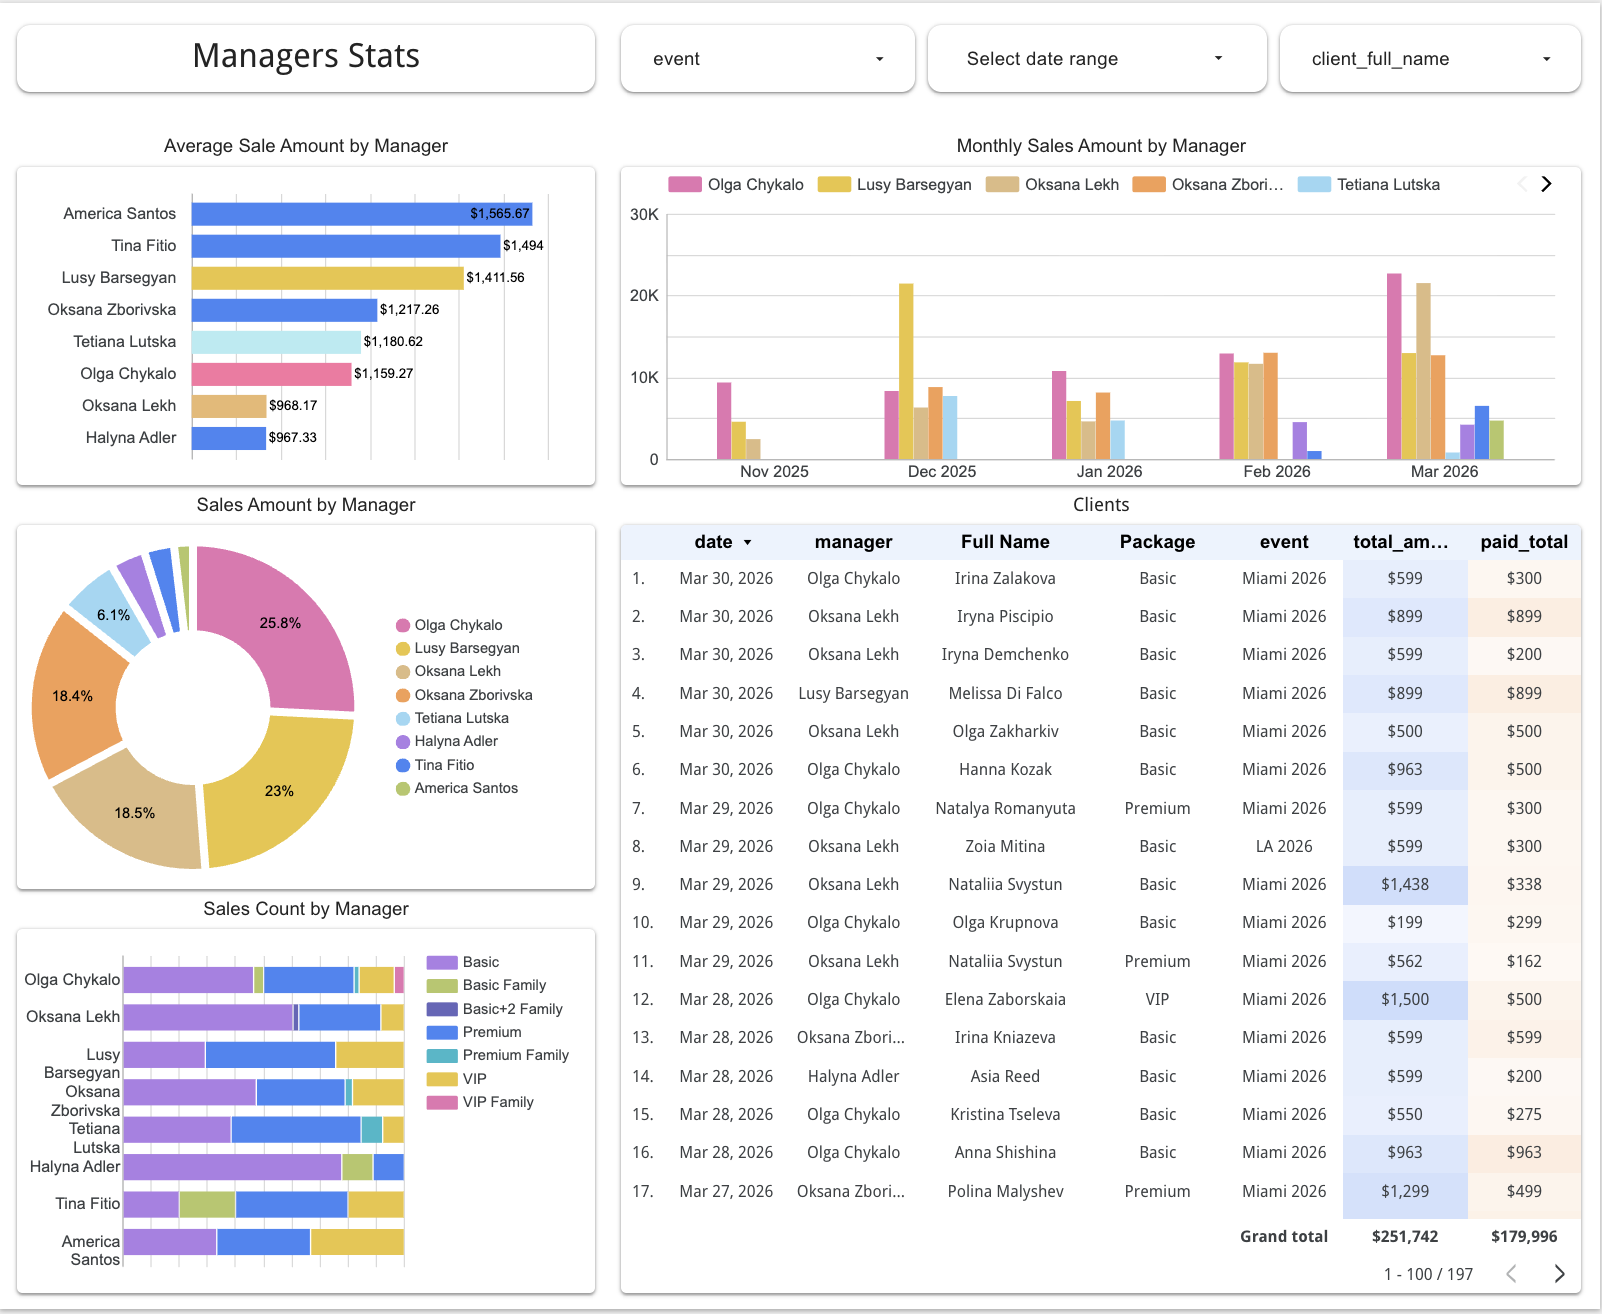
Manager Stats
Per-manager sales performance — average sale amount, monthly revenue trends, sales count by package type, and full client list with payment status.
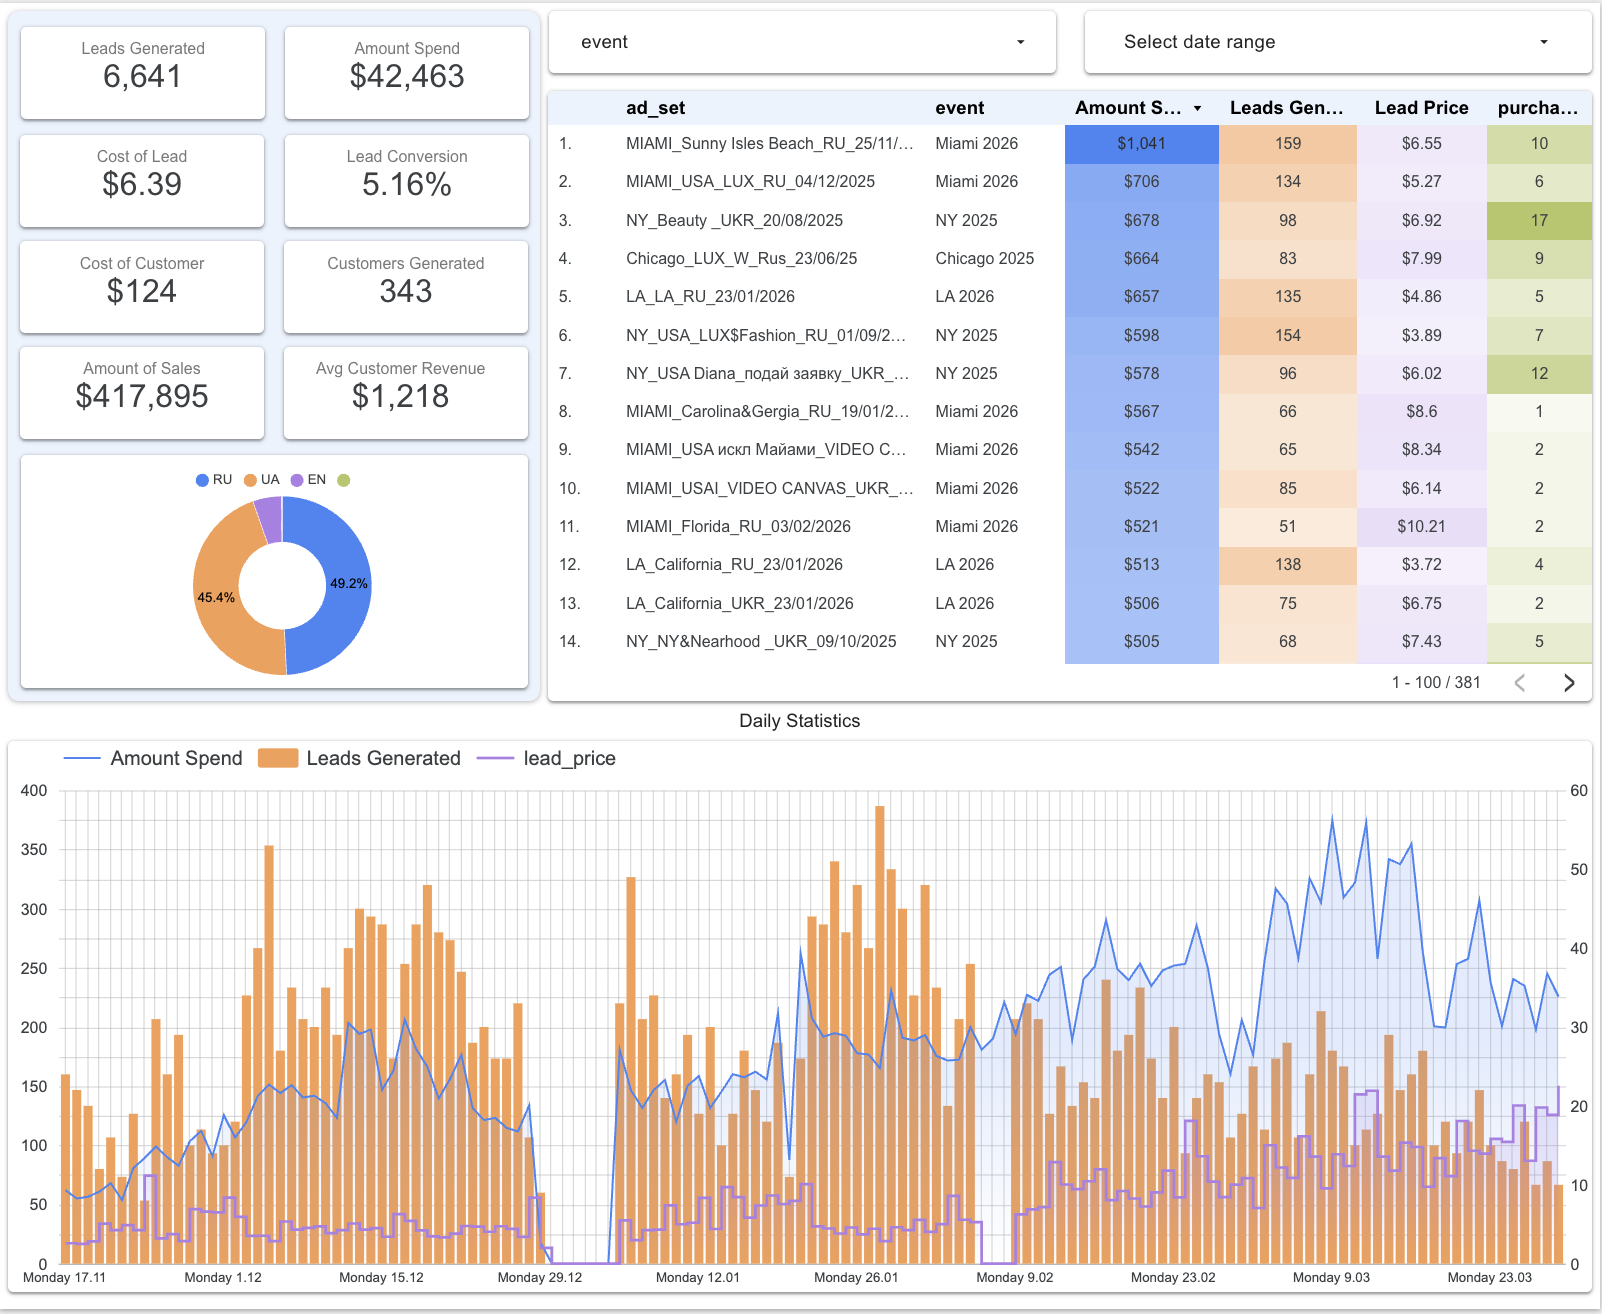
Marketing Analytics
End-to-end marketing funnel — leads generated, cost per lead, conversion rate, ad set performance ranking, and daily spend vs lead generation trends.
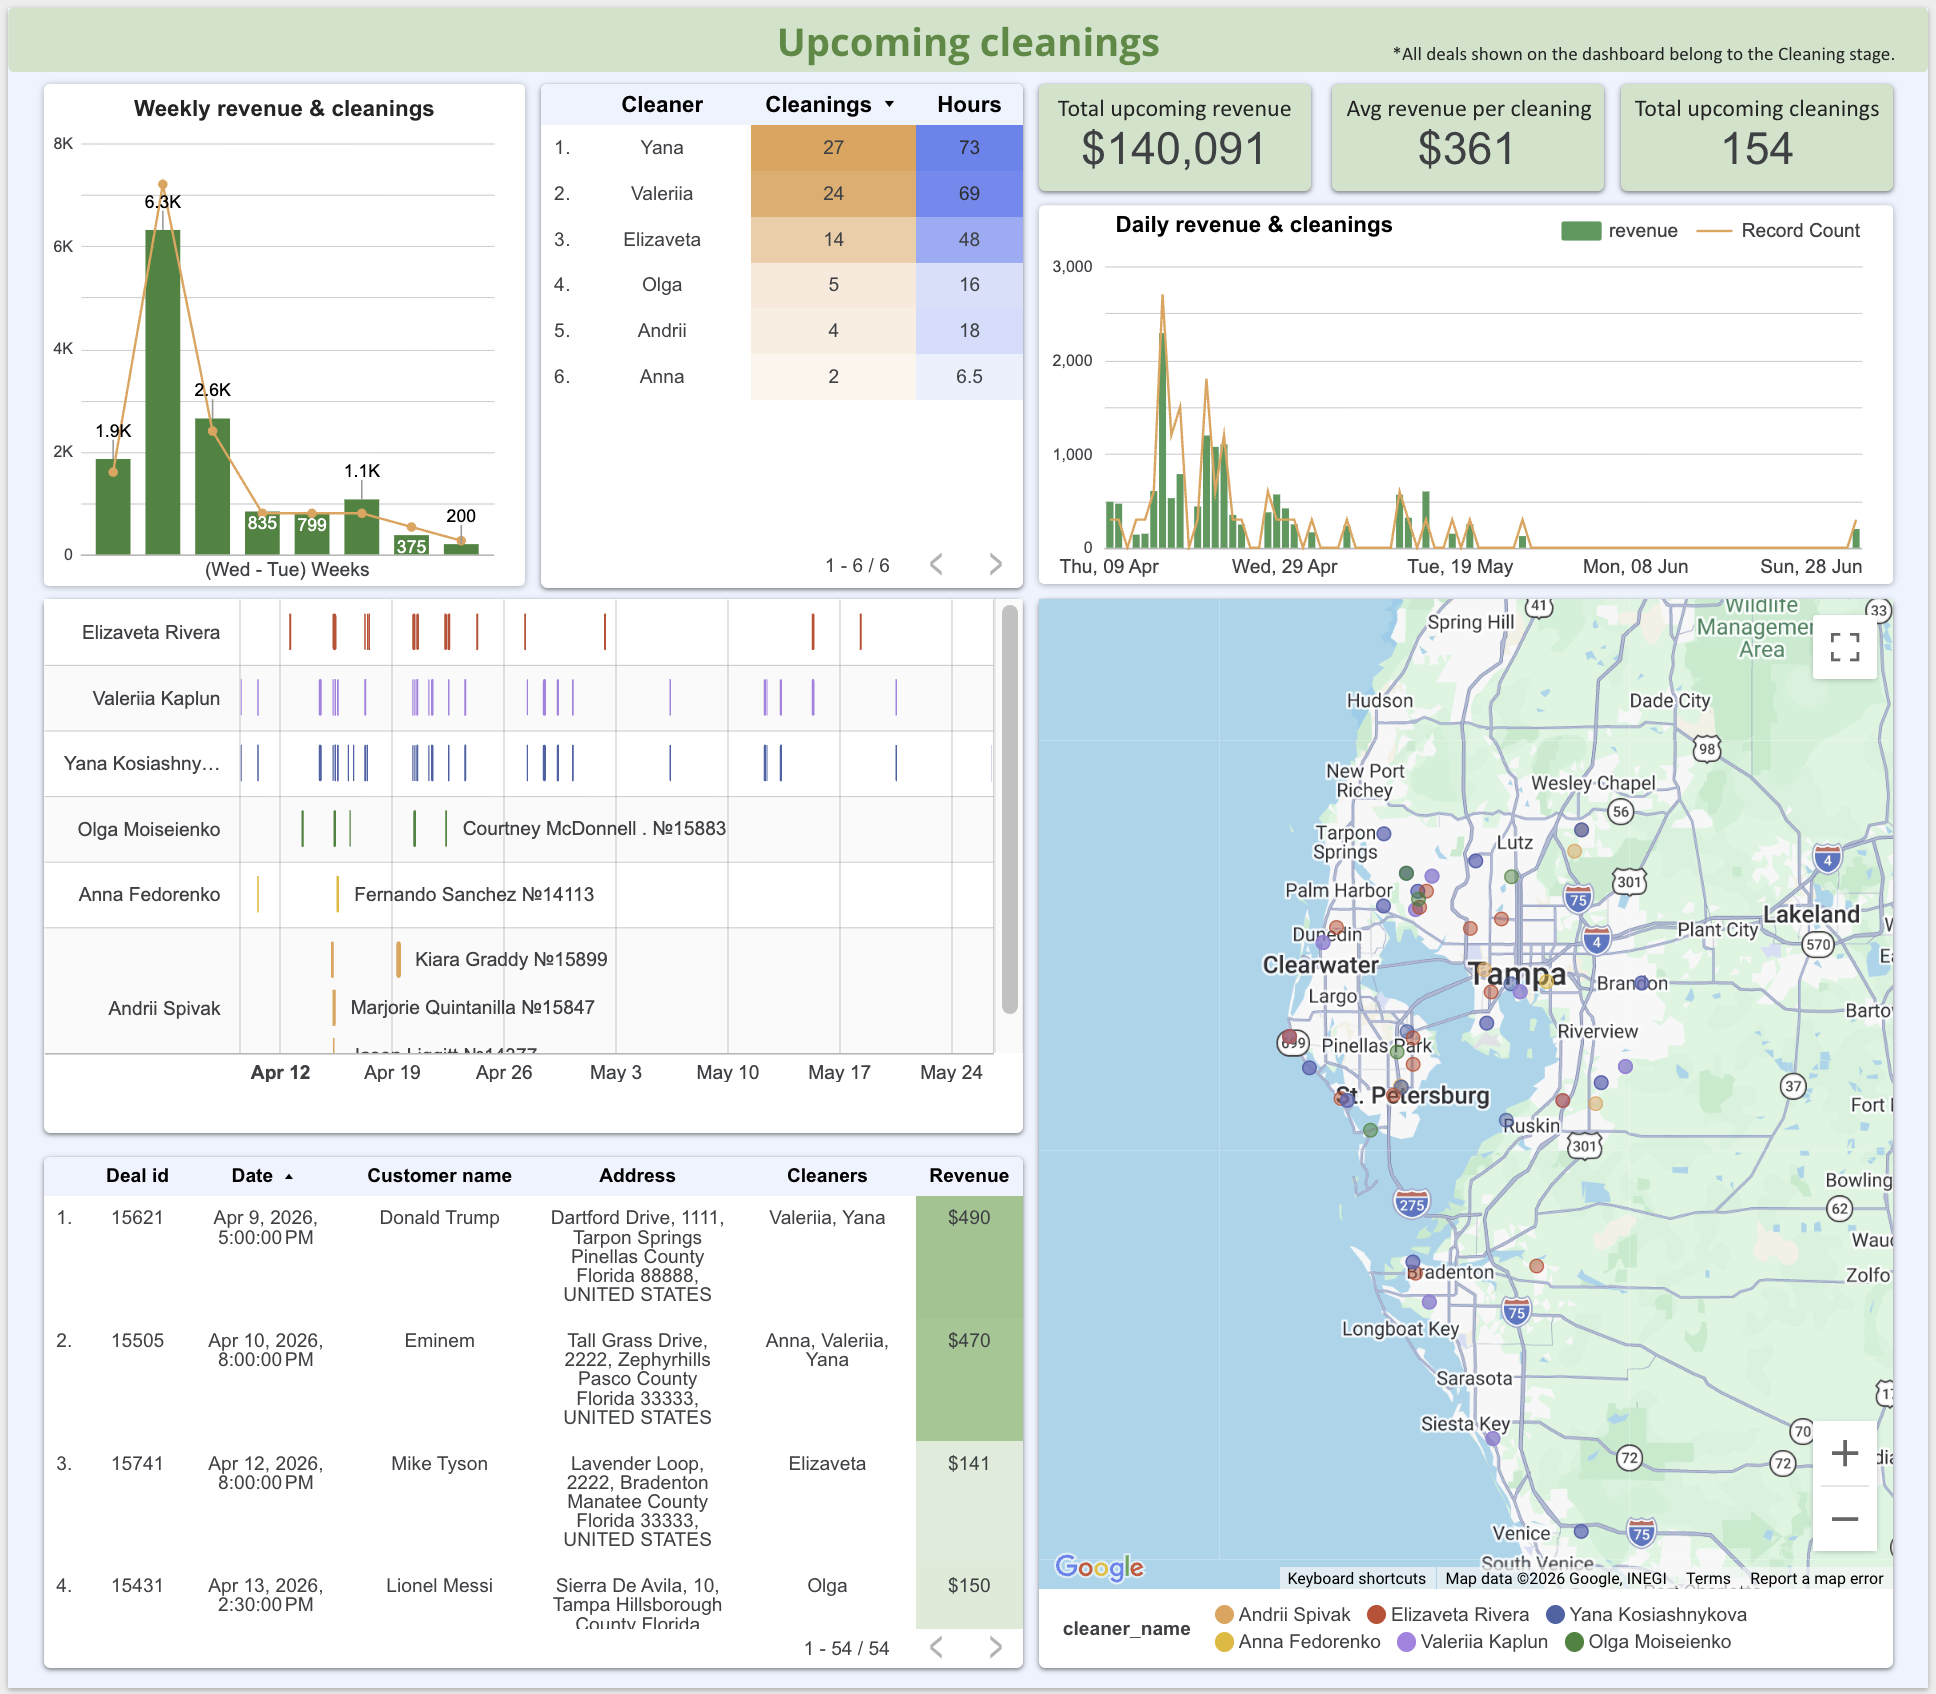
Upcoming Cleanings
Operational scheduling dashboard for a cleaning services company — shows weekly revenue, per-cleaner workload, timeline of upcoming jobs, and a geographic map of service locations.
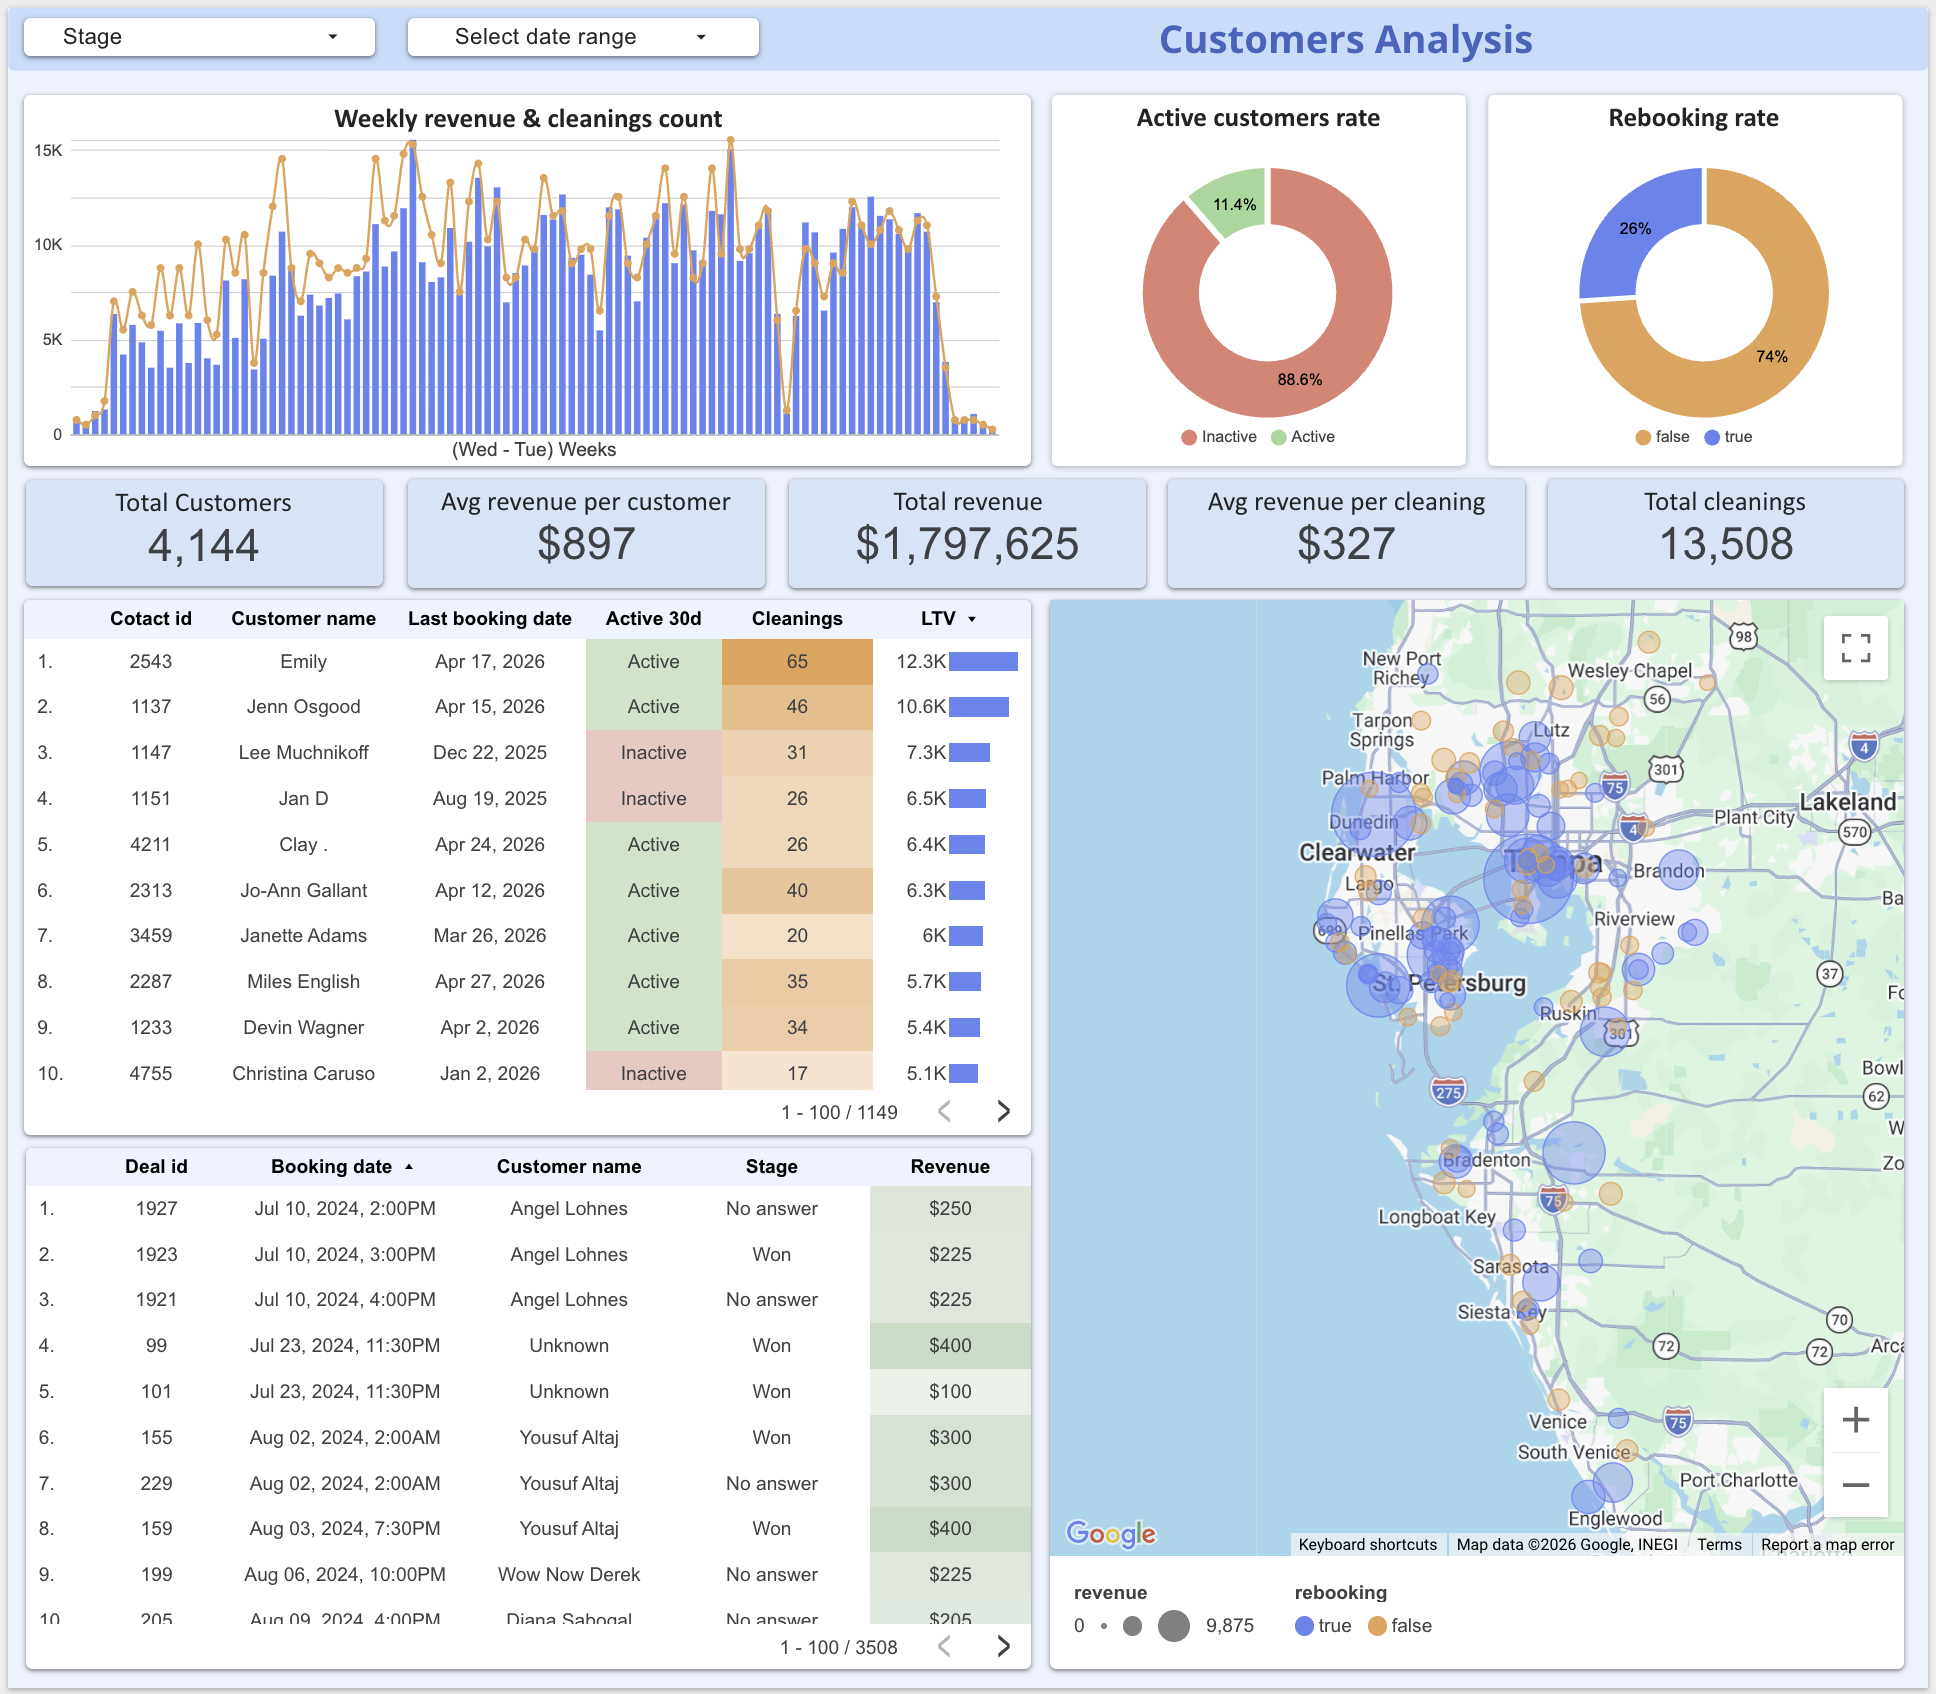
Customers Analysis
Customer lifetime value and retention dashboard — tracks total customers, revenue per customer, active vs inactive segmentation, rebooking rate, and full booking history per client.
Technologies Used
The full stack behind the dashboards, pipelines, and integrations — from raw API extraction to production reporting.